Compact
A four-plot route for a focused first pass. It keeps the complete measured summary while publishing fewer visual maps.
Explore the Compact report →AudioAtlas turns one local audio file into a portable listening map: measured context, clear plots, and bounded places to check by ear—measurements, not grades.
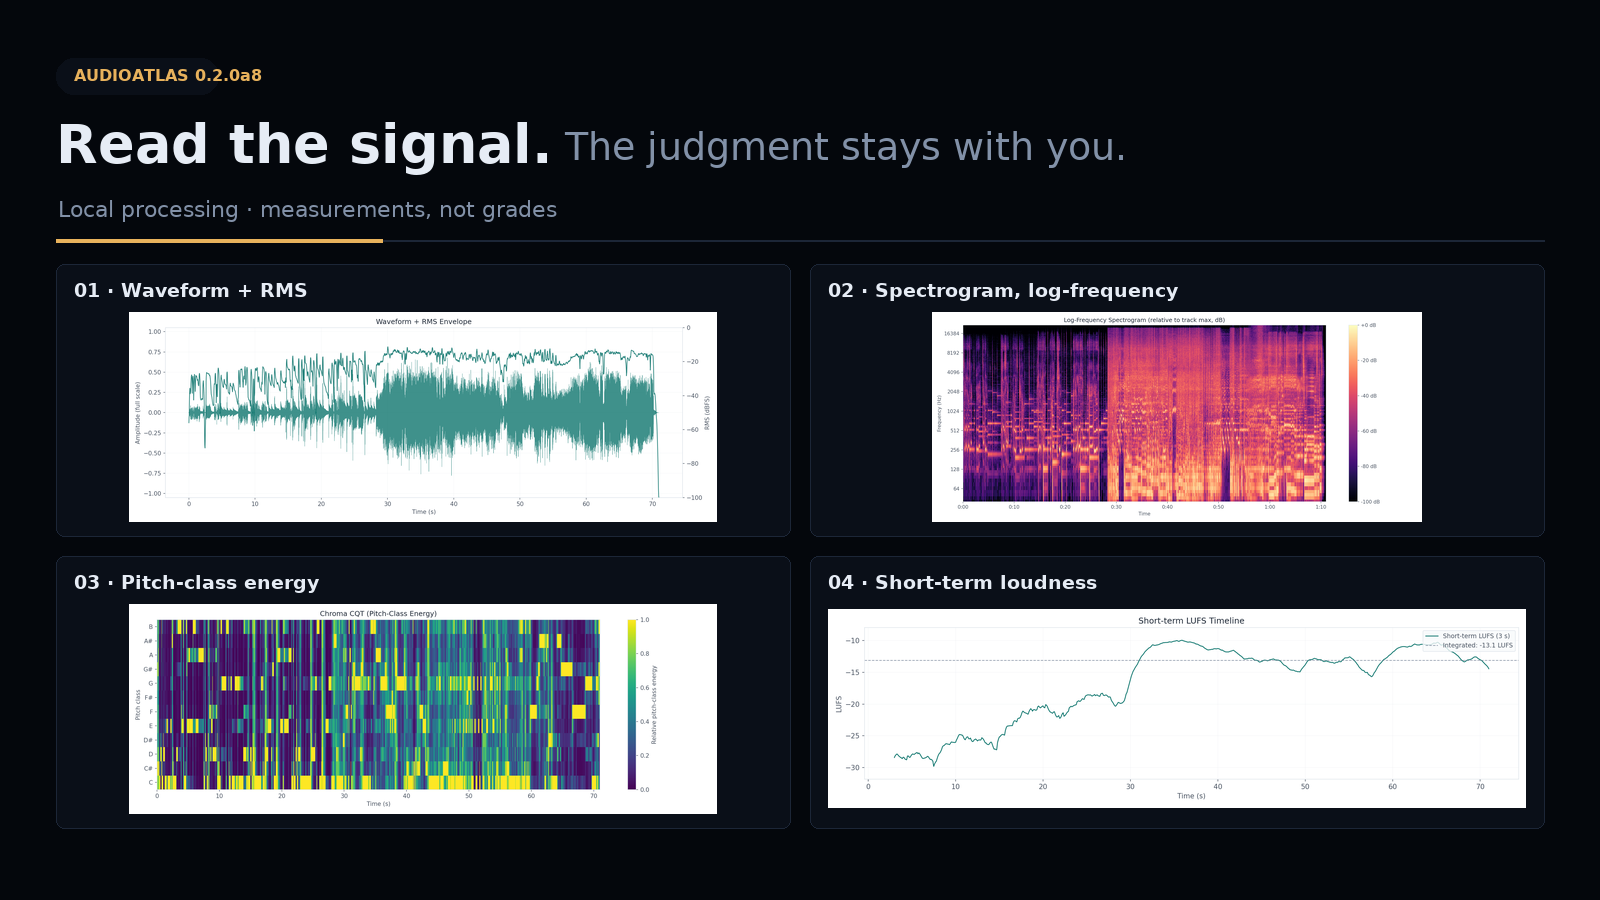
A four-plot route for a focused first pass. It keeps the complete measured summary while publishing fewer visual maps.
Explore the Compact report →Every registered plot for readers who want the broadest technical view. The underlying analysis is the same.
Explore the Full report →AudioAtlas runs locally through its Python 3.11+ CLI on Windows, macOS, and Linux. There is no account, telemetry, hosted dashboard, or intentional audio upload. These examples are static files with no analytics, cookies, remote fonts, external JavaScript, or source audio. No native desktop download is included in this release.